
Our World in Data
Verified working Jul 31, 2026
Open charts and explainers on major global trends and problems.
Our World in Data is a nonprofit publication and data portal that turns global datasets into charts, topic guides, and short research articles. It covers areas such as population, climate, health, poverty, education, democracy, food, energy, and technology, with openly licensed materials designed for reuse.
Why it stands out
- Combines data visualization with plain-language research context rather than presenting raw tables alone.
- Covers many of the same global indicators across countries and long time spans, making comparisons easier.
- Open licensing and free access make it unusually reusable for education, media, and public-interest work.
- Frequently cites and integrates major external data providers such as WHO and other international datasets.
Good to know
- Coverage is strongest for broad global and national indicators, not highly local or real-time data needs.
- Datasets come from many source organizations, so definitions, update schedules, and measurement quality can vary by topic.
- Long-range projections shown in some charts should be treated as uncertain scenarios, not forecasts with guaranteed outcomes.
Under the radar: For many interactive charts, opening the chart and using its download/share options—or appending formats such as .csv to Grapher chart URLs—can get you the underlying data faster than searching the article text.
Photos
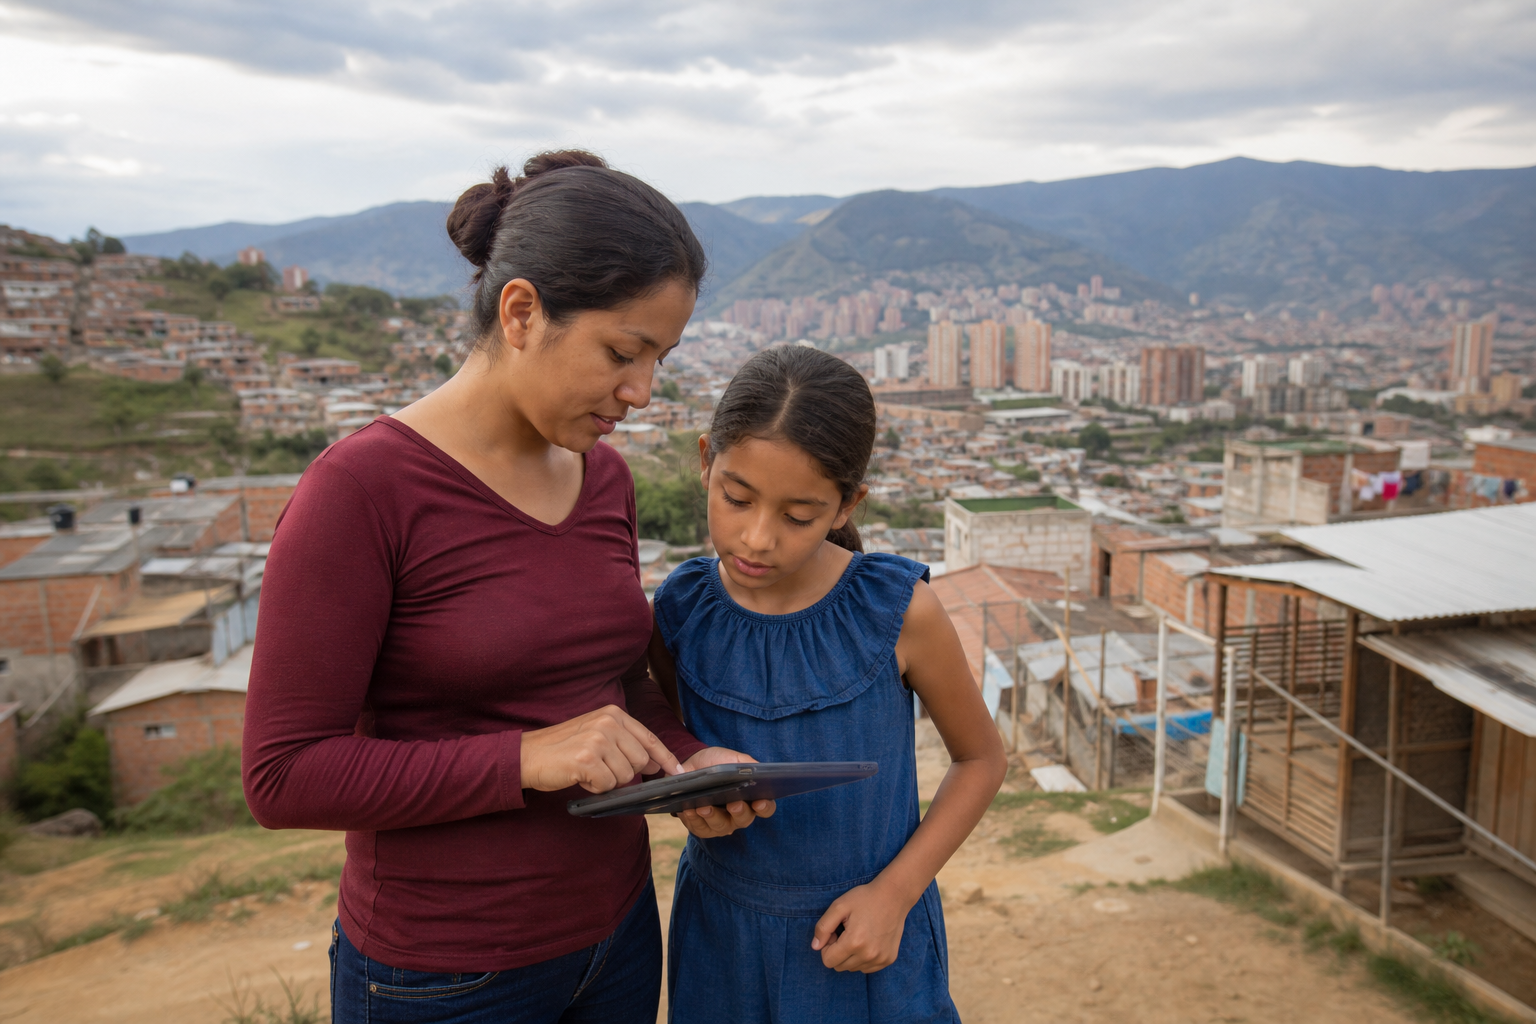
Researchers, journalists, educators, and policy analysts use it to find citable global data with clear visual context. Compare long-term trends across countries on topics like emissions, life expectancy, poverty, or population. Build classroom materials or presentations using open charts and explanatory articles. Follow newly updated datasets and short data-driven insights on current global issues.
Interactive charts across more than 100 topic areas; data explorers for comparing countries and time periods; research articles and topic pages explaining sources and methods; newsletters for updates; openly licensed charts, text, and data intended for reuse.
Technical Notes
- Many OWID chart pages expose downloadable structured data, commonly through Grapher CSV/JSON endpoints tied to the chart URL.
- Open data and related code are also published through Our World in Data’s GitHub presence, with reuse governed by open licenses.
Alternative listings
Global development indicators, surveys, and datasets in one official hub.
Open Data & Research PortalsWorld Bank Open Data is the World Bank Group’s public portal for development statistics, country profiles, indicators, survey data, and related analytical tools. It connects users to World Development Indicators, DataBank time series, the Microdata Library, the Data Catalog, and interactive Atlas visualizations covering topics such as poverty, health, education, infrastructure, climate, and economic growth.
1 votesVisit siteA global directory of open data portals with reusable exports.
Open Data & Research PortalsDataPortals.org catalogs open data portals operated by governments, international organizations, NGOs, and other institutions around the world. The site lets visitors browse the directory, contribute additions, and download the portal list as open data.
0 votesVisit site


Similar sites elsewhere
- Gapminder — gapminder.org
- World Bank Data — data.worldbank.org
- OECD Data — data.oecd.org
- UNdata — data.un.org
1 of 4