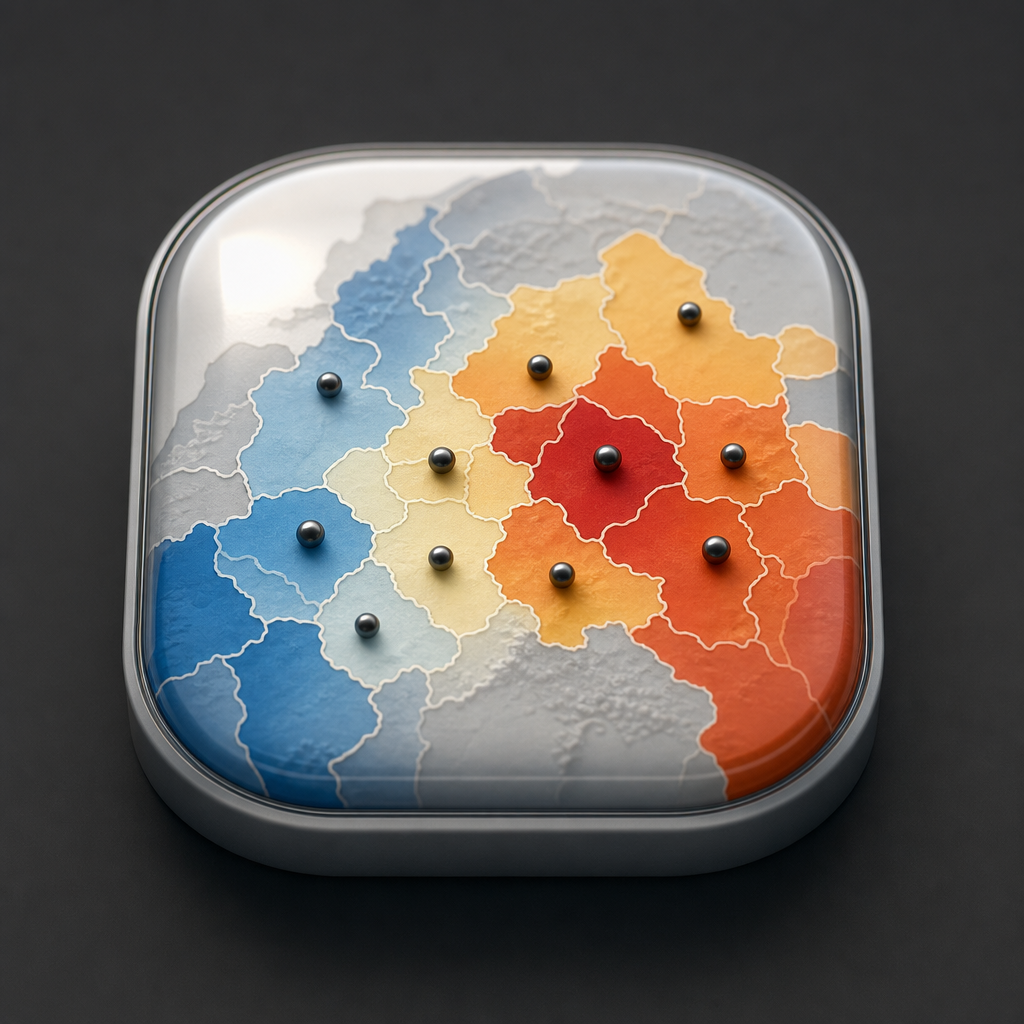
GeoDa
Desktop software for exploratory spatial statistics and cluster mapping.
GeoDa is a free, open-source desktop application for exploring spatial patterns in point and polygon data. It emphasizes exploratory spatial data analysis, linked maps and charts, spatial autocorrelation statistics, cluster detection, and introductory spatial regression without requiring users to code.
Why it stands out
- Makes specialized spatial statistics accessible through a GUI rather than requiring R, Python, or command-line workflows.
- Focuses on statistical results in maps and charts, not just visual display of raw geographic data.
- Includes a broad set of local cluster and spatial autocorrelation methods, including categorical join count maps and multivariate local Geary maps.
- Handles many GIS vector formats and can convert coordinates or export subsets into new spatial files.
- Has a long academic lineage and documented use in university labs and spatial analysis teaching.
Good to know
- Large datasets generally need to be aggregated to areal units before analysis.
- The site describes typical analysis scale as several thousand aggregate records or tens of thousands of point/polygon records, not massive raw datasets.
- Multi-layer support is primarily for visualization; analysis is performed on the first loaded layer.
- The listed Linux build targets Ubuntu, so users on other distributions may need extra setup or compatibility checks.
Under the radar: When using extra map layers for context, load the dataset you plan to analyze first; later layers can help with interpretation but are not the active analysis layer.
Photos

Urban planners, public-policy researchers, and GIS students can test whether mapped outcomes form statistically meaningful spatial clusters. Explore local Moran, Geary, G/G*, and join count results for demographic, election, health, or housing data. Compare spatial patterns across time using linked views, time grouping, and change-focused Moran tests. Convert common tabular coordinate data into spatial formats for analysis and mapping. Evaluate spatially constrained clustering methods such as SKATER, REDCAP, max-p, and spectral clustering.
Graphical ESDA workflow; linked maps and statistical charts; local and global spatial autocorrelation tools; basic spatial regression; spatially constrained and non-spatial clustering methods; time-aware views; basemap support for projected data; multi-layer visualization; support for shapefiles, GeoJSON, geodatabases, KML, GML, MapInfo, CSV/DBF/XLS/ODS tables, and other GDAL-backed vector formats.
Alternative listings
Desktop GIS focused on geoscientific and terrain analysis.
Mapping, geospatial & alternative cartography toolsSAGA GIS is a geospatial analysis project for working with scientific mapping and earth-surface data. The site functions mainly as a gateway to the SAGA project information and its SourceForge project page for downloads and updates.
0 votesVisit siteA local GIS toolkit for terrain, hydrology, LiDAR, and raster analysis.
Mapping, geospatial & alternative cartography toolsWhitebox provides a large collection of geospatial analysis tools usable from QGIS, Python, and R. Its open tier covers terrain modeling, hydrology, LiDAR, remote sensing, raster, and vector workflows, while licensed Pro bundles add structured reporting and reproducibility features for higher-stakes work.
0 votesVisit site

Similar sites elsewhere
- QGIS — qgis.org
- ArcGIS Pro — esri.com/en-us/arcgis/products/arcgis-pro/overview
- PySAL — pysal.org
- SaTScan — satscan.org
1 of 5